Introduction:

Imagine a situation where you are a subject in an experiment that involves a finger prick, a series of shocks, and to top it off you are hungry because you have not eaten for over 2 hours. Chances are that this experiment might involve a stress response.
Research Question:
How does intensity of muscle stimulus affect average percent change in heart rate and average percent change in blood glucose levels in humans?
Scientific Rationale:
Heart Rate:
In our experiment we hypothesize that as the amplitude of the stimulus increases heart rate will also increase. The reasoning behind this is due to the General Adaption Syndrome coined by Hans Seyle. Seyle describes the GAS as a triad of symptoms of stressors (adrenal hypertrophy, atropy of the thymus and gastric ulcers), which work in three distinct phases. During the first phase, or the alarm phase, the subject undergoing stress (induced shock) will initiate the fight or flight response in order to prepare the body physically (Silverthorn, 2012). One way the body does this is by increasing heart rate in order to increase blood supply to the various organs, the most important one being the brain. In the alarm phase (caused by induced stress) the body will increase heart rate by stimulation of the sympathetic nervous system (SNS). Stimulation of the SNS generates action potentials down the presynaptic sympathetic neuron, releasing acetylcholine onto nicotinic receptors of the postsynaptic sympathetic neuron within the autonomic ganglion (Welsh, 2013). The postsynaptic sympathetic neuron then releases catecholamines into the blood, which travels into the general circulation as a neurohormone. The adrenal medulla is also able to synthesize and secrete catecholamines into the blood through the stimulation of the SNS. A target of catecholamines, norepinephrine and epinephrine, are beta-1-adrenergic receptors on autorhythmic cells of the heart. Through a second messenger cascade process, the activation of the beta-1-adrenergic receptors increases the permeability of sodium and calcium into the autorhythmic cells, making it easier for the cells to depolarize and thus increasing heart rate (Silverthorn, 2012).
Blood Glucose:
Another part of our hypothesis predicted that we would also see a rise in blood glucose levels as amplitude of the stimulus increased. Again we can turn to the GAS and look at the first phase (alarm) and the second phase (resistance). As already stated earlier the alarm phase will cause the stimulation of the SNS and the release of catecholamines into circulation. More importantly the catecholmamine epinephrine will be secreted and will cause an increase in blood glucose levels. The ways that this is accomplished is by epinephrine facilitating gluconeogenesis in the liver (Silverthorn, 2012). Epinephrine also causes the break down of fat (lipolysis) into free fatty acids and glycerol, which can be used as a substrate for gluconeogenesis. Overall, this first phase will cause the subjects to have an increased blood glucose level due to our induced stress of changing stimulus amplitude. Then, according to Seyle’s GAS, the subject will enter the second phase or the resistance phase. Under chronic stress, the hypothalamic-pituitary-adrenal axis (HPA axis) is activated. Stress stimulates the hypothalamus to release increased levels of corticotropin releasing hormone (CRH). Through a series of steps CRH signals to the anterior pituitary to release adrenocorticotropic hormone (ACTH). The presence of ACTH tells the adrenal cortex to release cortisol into the blood. Once the cortisol enters the general circulation it primarily functions to increase blood glucose levels through gluconeogenesis in the liver. Similar to epinephrine, cortisol will cause lipolysis, which allows for the use of glycerol as a substrate in gluconeogenesis. One final comment on the functions of cortisol is that it also inhibits glucose uptake from secondary and accessory organs, further increasing glucose levels in the blood for use primarily in the brain (Silverthorn, 2013).
Hypothesis:
As muscle stimulus intensity increases there will be a greater average percent change in heart rate and a greater average percent change in blood glucose levels in humans.
Methods:
Subjects:
•Subject #1: Male student. Age 22
•Subject #2: Female student. Age 21
•Subject #3: Female student. Age 21
•Subject #4: Female student. Age 21
•Subject #5: Male student. Age 21
•Subject #6: Male student. Age 21
•Subject #1: Male student. Age 22
•Subject #2: Female student. Age 21
•Subject #3: Female student. Age 21
•Subject #4: Female student. Age 21
•Subject #5: Male student. Age 21
•Subject #6: Male student. Age 21
Equipment:
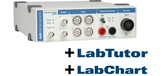
LabChart + PowerLab
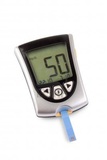
Glucometer
Test Strips
Test Strips
Lancets
Biohazard container
Gloves
Alcohol Swabs
Gauze
Bandaids
Biohazard container
Gloves
Alcohol Swabs
Gauze
Bandaids

Stimulating Bar Electrode
Electrocardiograph (ECG)
Electrodes
Electrode Cream
Electrodes
Electrode Cream
Procedure:
Effect of Muscle Stimulus Intensity on Heart Rate and Blood Glucose Levels
Effect of Muscle Stimulus Intensity on Heart Rate and Blood Glucose Levels
- Have the subject sit in a chair that will face away from the experimenters (so the subject cannot see the amplitude of the the stimulus).
- Connect student to the bar electrode by placing the bar electrode on the left abductor pollicis brevis and the leads of the ECG (White on the right shoulder, black on the left shoulder and green on the left hip). Make sure to place the leads on the on more muscular portions of the body and not directly on the bone.
- Turn on powerlab and make sure all equipment is recording and connected correctly by recording a sample ECG on the computer monitor.
- Next, record heart rate for three seconds without applying any intensity to the bar electrode. This will serve as the baseline for the heart rate before applying the stimulus.
- Immediately after the three seconds record blood glucose levels by using the glucometer. Let the student rest for one minute. Without letting the student see the intensity of the stimulus, select randomly one intensity out of (10 mA, 12 mA, 14 mA, 16 mA, 18 mA). Apply stimulus for 3 seconds at a frequency of 2 H. Make a comment on lab chart about where you started recording the heart rate and make a comment where you ended recording heart rate. This will make it easier to analyze your data later. Immediately after recording the heart rate for 3 seconds, take blood glucose levels. Let the subject rest for one minute before repeating the process again. Repeat this procedure until all five stimuli intensity values have been recorded. (Be sure to record both heart rate and blood glucose levels after the stimulus has been applied as well as during each minute of rest). Repeat this process with each subject, and record data into a raw data table.
- Using Excel calculate average percent change in heart rate and the average percent change in blood glucose levels (Experimental value - Baseline value / Baseline value), as well as the standard deviations for each amplitude intensity (mA). Make a summary table.
Results:
Summary Table:
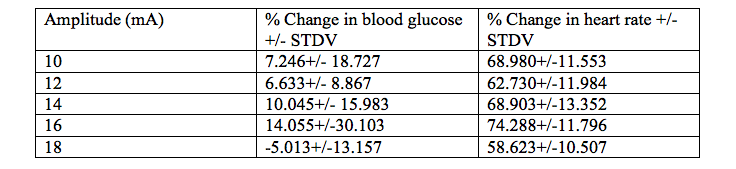
Table 1. The average percent change of blood glucose levels and the average percent change of heart rate under different amplitude stimuli (10mA-18mA) in 6 CU college students.
Table 1. The average percent change of blood glucose levels and the average percent change of heart rate under different amplitude stimuli (10mA-18mA) in 6 CU college students.
Graphs:
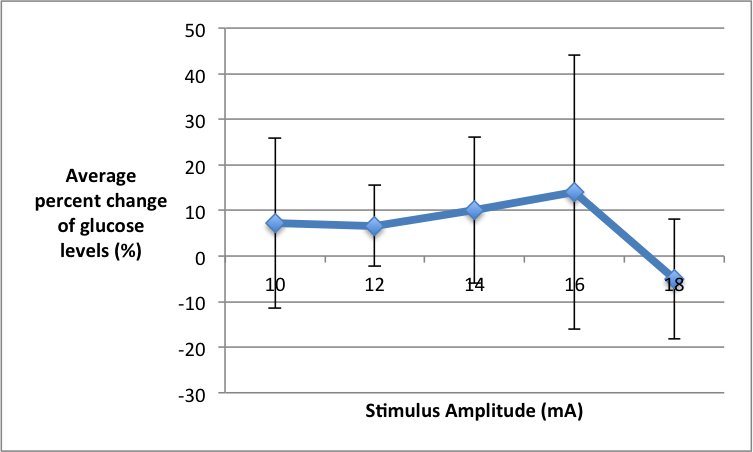
Figure 1. The average percent change of blood glucose levels under different amplitude stimuli (10mA-18mA) in 6 CU college students. Blood glucose levels were measured by pricking the students’ fingers using a lancing device and test strips; the test strip was inserted into a glucometer, which gave the blood glucose readings. Amplitude was manipulated using a bar electrode, which was connected to PowerLab and transduced and read through LabChart.
Quantitative Summary of Results and Overall Trend: At the lowest stimulus intensity of 10mA we saw an average percent change of blood glucose at 7.24%. As stimulus intensity was increased to 14mA we saw the average percent change of blood glucose levels increase to 10.04%. At a stimulus intensity of 16 mA we saw the maximum average percent change in blood glucose levels at 14.05%. At the highest stimulus intensity of 18mA we saw a negative average percent change of -5.01% of blood glucose levels. The overall trend suggests that as you increase stimulus amplitude the average percent change of blood glucose levels will increase until 18 mA of stimulus is applied and then the average percent change of blood glucose levels will decrease.
Quantitative Summary of Results and Overall Trend: At the lowest stimulus intensity of 10mA we saw an average percent change of blood glucose at 7.24%. As stimulus intensity was increased to 14mA we saw the average percent change of blood glucose levels increase to 10.04%. At a stimulus intensity of 16 mA we saw the maximum average percent change in blood glucose levels at 14.05%. At the highest stimulus intensity of 18mA we saw a negative average percent change of -5.01% of blood glucose levels. The overall trend suggests that as you increase stimulus amplitude the average percent change of blood glucose levels will increase until 18 mA of stimulus is applied and then the average percent change of blood glucose levels will decrease.
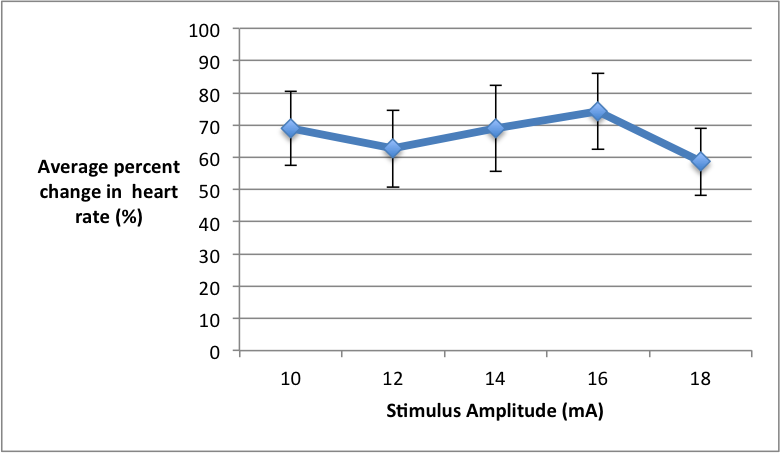
Figure 2. The average percent change of heart rate under different amplitude stimuli (10-18mA) in 6 CU college students. Heart rate was measured by hooking students up to an Electrocardiogram (ECG), which was further connected to PowerLab and transduced and read through LabChart. Amplitude was manipulated using a bar electrode, which was also connected to PowerLab and LabChart.
Quantitative Summary of Results and Overall Trend: At the lowest stimulus intensity of 10mA the average percent change of heart rate was 68.98%. As stimulus intensity increased to 12 mA there was a slight decrease in percent change of heart rate to 62.73%. As stimulus intensity was further increased we saw average percent change of heart rate increase as well, and it peaked to its maximum of 74.28% under the 16 mA stimulus. Similarly, to the average percent change of blood glucose levels, once the stimulus of 18 mA was applied the average percent change of heart decreased to 58.62%. The overall trend suggests that as stimulus intensity increases the average percent change of heart rate will also increase, but once 18mA of stimulus is applied the average percent change of heart rate will decrease.
Quantitative Summary of Results and Overall Trend: At the lowest stimulus intensity of 10mA the average percent change of heart rate was 68.98%. As stimulus intensity increased to 12 mA there was a slight decrease in percent change of heart rate to 62.73%. As stimulus intensity was further increased we saw average percent change of heart rate increase as well, and it peaked to its maximum of 74.28% under the 16 mA stimulus. Similarly, to the average percent change of blood glucose levels, once the stimulus of 18 mA was applied the average percent change of heart decreased to 58.62%. The overall trend suggests that as stimulus intensity increases the average percent change of heart rate will also increase, but once 18mA of stimulus is applied the average percent change of heart rate will decrease.
Discussion:
Interpretation, Strengths/Limitations, and Future Directions
Overall, the data supported our to hypothesis to an extent. We predicted that as the stimulus amplitude increased then both heart rate and glucose levels would also increase. This was true for blood glucose levels, in which we saw a positive increase, from the baseline, in percent change of blood glucose levels for our first four amplitudes. This can be explained by our rationale of the General Adaption Syndrome (GAS). However, the data did not support our hypothesis with the last stimulus amplitude of 18 mA. At this point the data indicates that there was a negative percent change in blood glucose levels suggesting that there was glucose uptake by peripheral tissues. Moreover, a possible rationale behind this (that would need further testing and experimenting) is that the stimulus of 18 mA was so intense, that it caused the muscle that was stimulated by the bar electrode (abductor pollicis brevis) to uptake glucose and create ATP in order to maintain the pulsatile twitching of the induced shock. As for heart rate, our hypothesis was supported to an extent, in that we saw an increase of percent change of heart rate in three out of the five stimulus amplitudes. Again this can be rationalized due to the GAS . The most significant data point that refuted our hypothesis however, was the last and most intense stimulus of 18 mA. Here we saw an actual decrease in percent change of heart rate. A possible explanation for this is that although we selected the stimulus amplitudes at random (drawing out of a beaker) 18 mA was always one of the last two. Thus, the subjects may have anticipated the intense stimulus and through this anticipation the student experienced stress. This leads us to discuss the strengths and weaknesses of the lab. Some of the major weaknesses of this lab were, the ability to account for subject’s different abilities for handling stress. Although we did test three males and three females, some people cope with stress better than others and therefore were not affected as significantly by the induced stress. The timing of the lab may have affected the stress levels as well, in that we were testing college students a few weeks prior to finals. This means that the subjects may have already been under some acute stress prior to the experiments. Moreover, we selected our own subjects from friends and classmates. The friends we had perform the experiment may have been more relaxed during the lab due to small talk made during resting periods as compared to the classmates who were silent during the resting periods. The major strength of our lab was our randomization of the stimulus amplitudes. By drawing the amplitudes out of a beaker we were able to remove the anticipation of the stimulus getting stronger by the subject, thus allowing for the stress to be induced affectively. Another strength of our lab was a baseline recording between each stimulus to get an accurate controlled reading when no stimulus was applied. The student, however, was still going through the same process in order to determine if any stress was related to the anticipation of being shocked. Finally, for further experiments we suggest a similar or even the same experiment, but this time we would compare our results by sex.
Overall, the data supported our to hypothesis to an extent. We predicted that as the stimulus amplitude increased then both heart rate and glucose levels would also increase. This was true for blood glucose levels, in which we saw a positive increase, from the baseline, in percent change of blood glucose levels for our first four amplitudes. This can be explained by our rationale of the General Adaption Syndrome (GAS). However, the data did not support our hypothesis with the last stimulus amplitude of 18 mA. At this point the data indicates that there was a negative percent change in blood glucose levels suggesting that there was glucose uptake by peripheral tissues. Moreover, a possible rationale behind this (that would need further testing and experimenting) is that the stimulus of 18 mA was so intense, that it caused the muscle that was stimulated by the bar electrode (abductor pollicis brevis) to uptake glucose and create ATP in order to maintain the pulsatile twitching of the induced shock. As for heart rate, our hypothesis was supported to an extent, in that we saw an increase of percent change of heart rate in three out of the five stimulus amplitudes. Again this can be rationalized due to the GAS . The most significant data point that refuted our hypothesis however, was the last and most intense stimulus of 18 mA. Here we saw an actual decrease in percent change of heart rate. A possible explanation for this is that although we selected the stimulus amplitudes at random (drawing out of a beaker) 18 mA was always one of the last two. Thus, the subjects may have anticipated the intense stimulus and through this anticipation the student experienced stress. This leads us to discuss the strengths and weaknesses of the lab. Some of the major weaknesses of this lab were, the ability to account for subject’s different abilities for handling stress. Although we did test three males and three females, some people cope with stress better than others and therefore were not affected as significantly by the induced stress. The timing of the lab may have affected the stress levels as well, in that we were testing college students a few weeks prior to finals. This means that the subjects may have already been under some acute stress prior to the experiments. Moreover, we selected our own subjects from friends and classmates. The friends we had perform the experiment may have been more relaxed during the lab due to small talk made during resting periods as compared to the classmates who were silent during the resting periods. The major strength of our lab was our randomization of the stimulus amplitudes. By drawing the amplitudes out of a beaker we were able to remove the anticipation of the stimulus getting stronger by the subject, thus allowing for the stress to be induced affectively. Another strength of our lab was a baseline recording between each stimulus to get an accurate controlled reading when no stimulus was applied. The student, however, was still going through the same process in order to determine if any stress was related to the anticipation of being shocked. Finally, for further experiments we suggest a similar or even the same experiment, but this time we would compare our results by sex.
